1. 从某个基坑工程监测数据报表说起 笔者参与的几个真实大型工程项目,作为科研单位从施工现场获取数据往往仅有两种方式:
和业主、监理、施工和监测单位协调现场安装自动化监测设备;
直接咨询施工单位或监测单位,看能否要到监测报表。
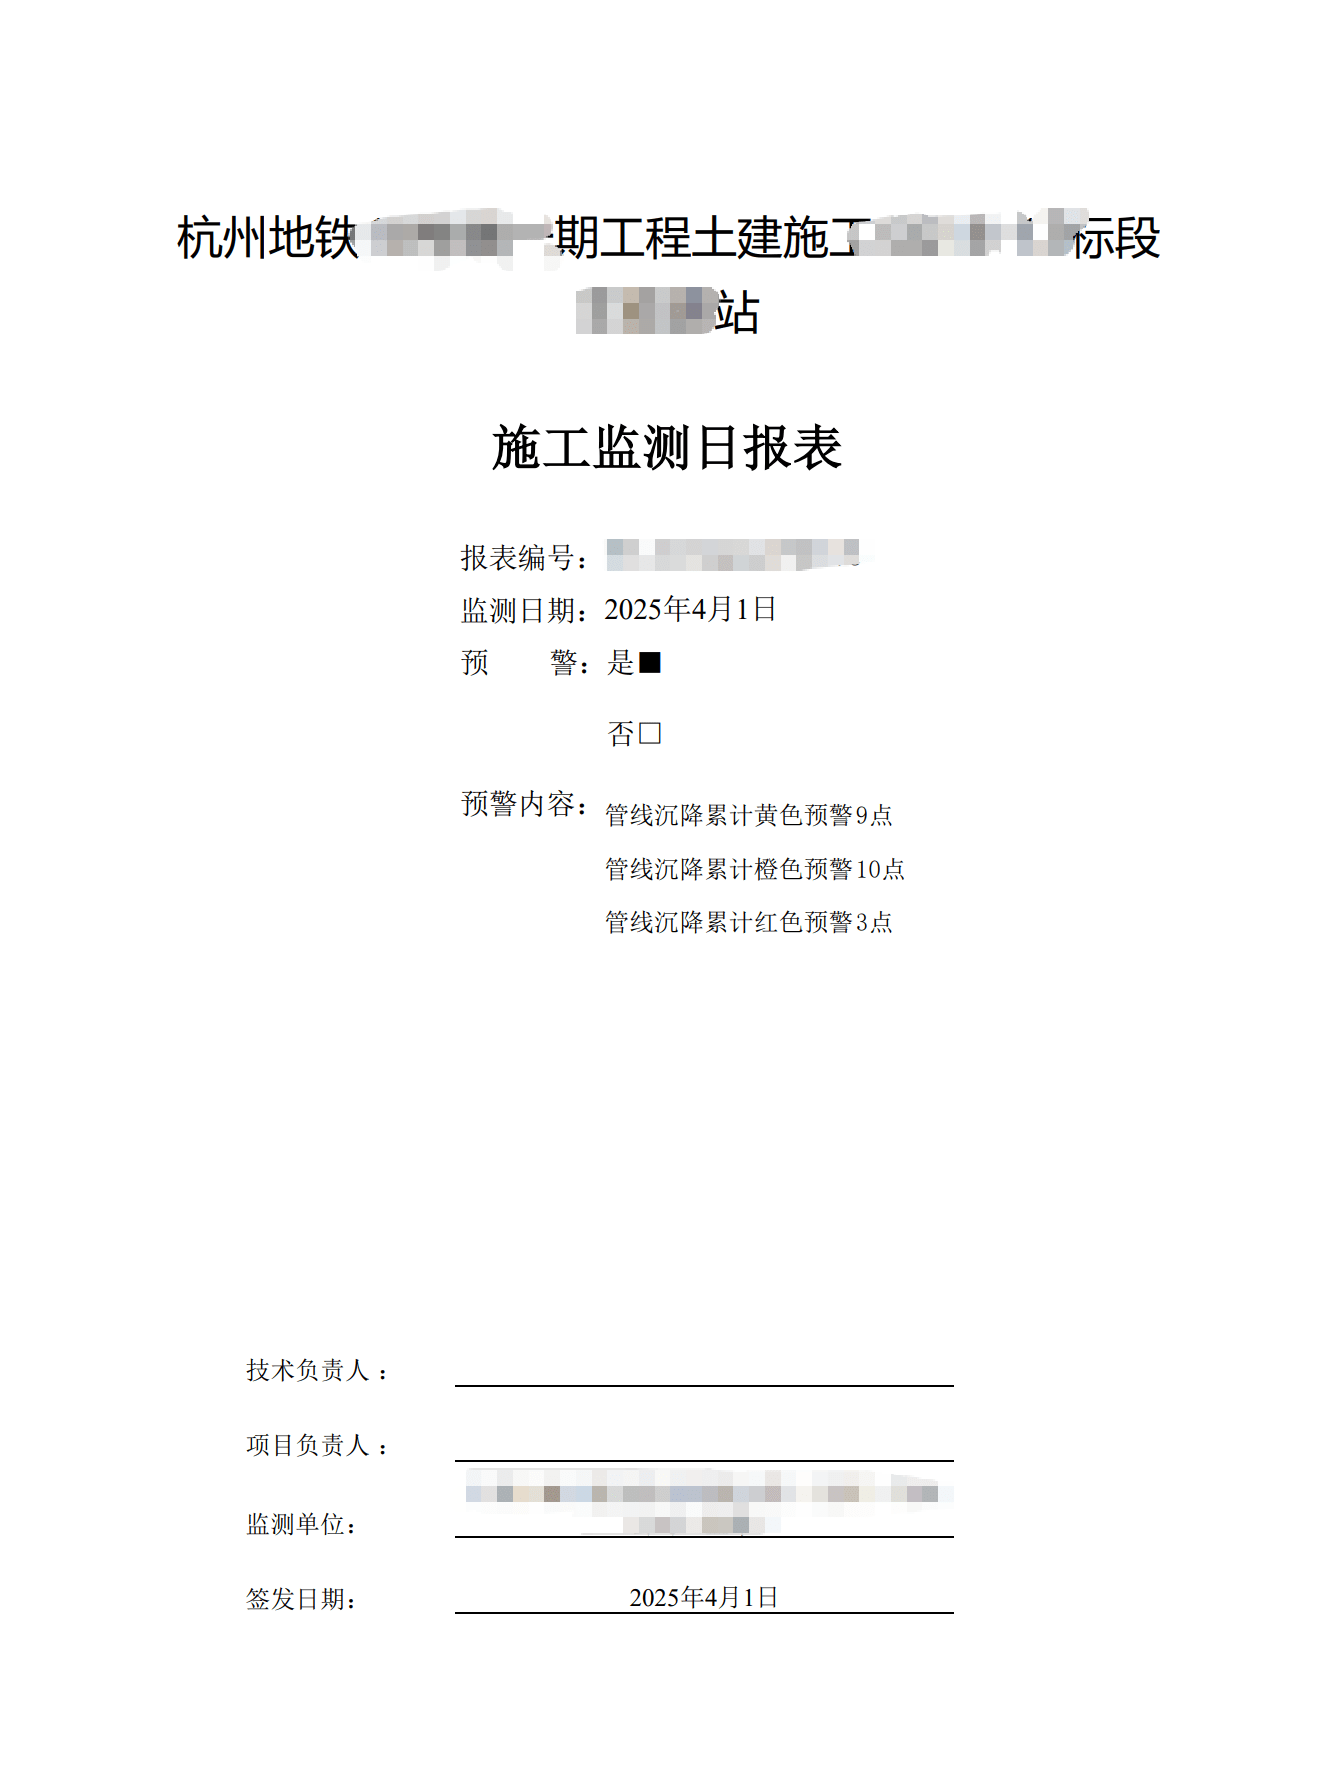
其中后者往往要到的是PDF格式的日报表或周报表,如图所示:
其数据格式具有以下特征:
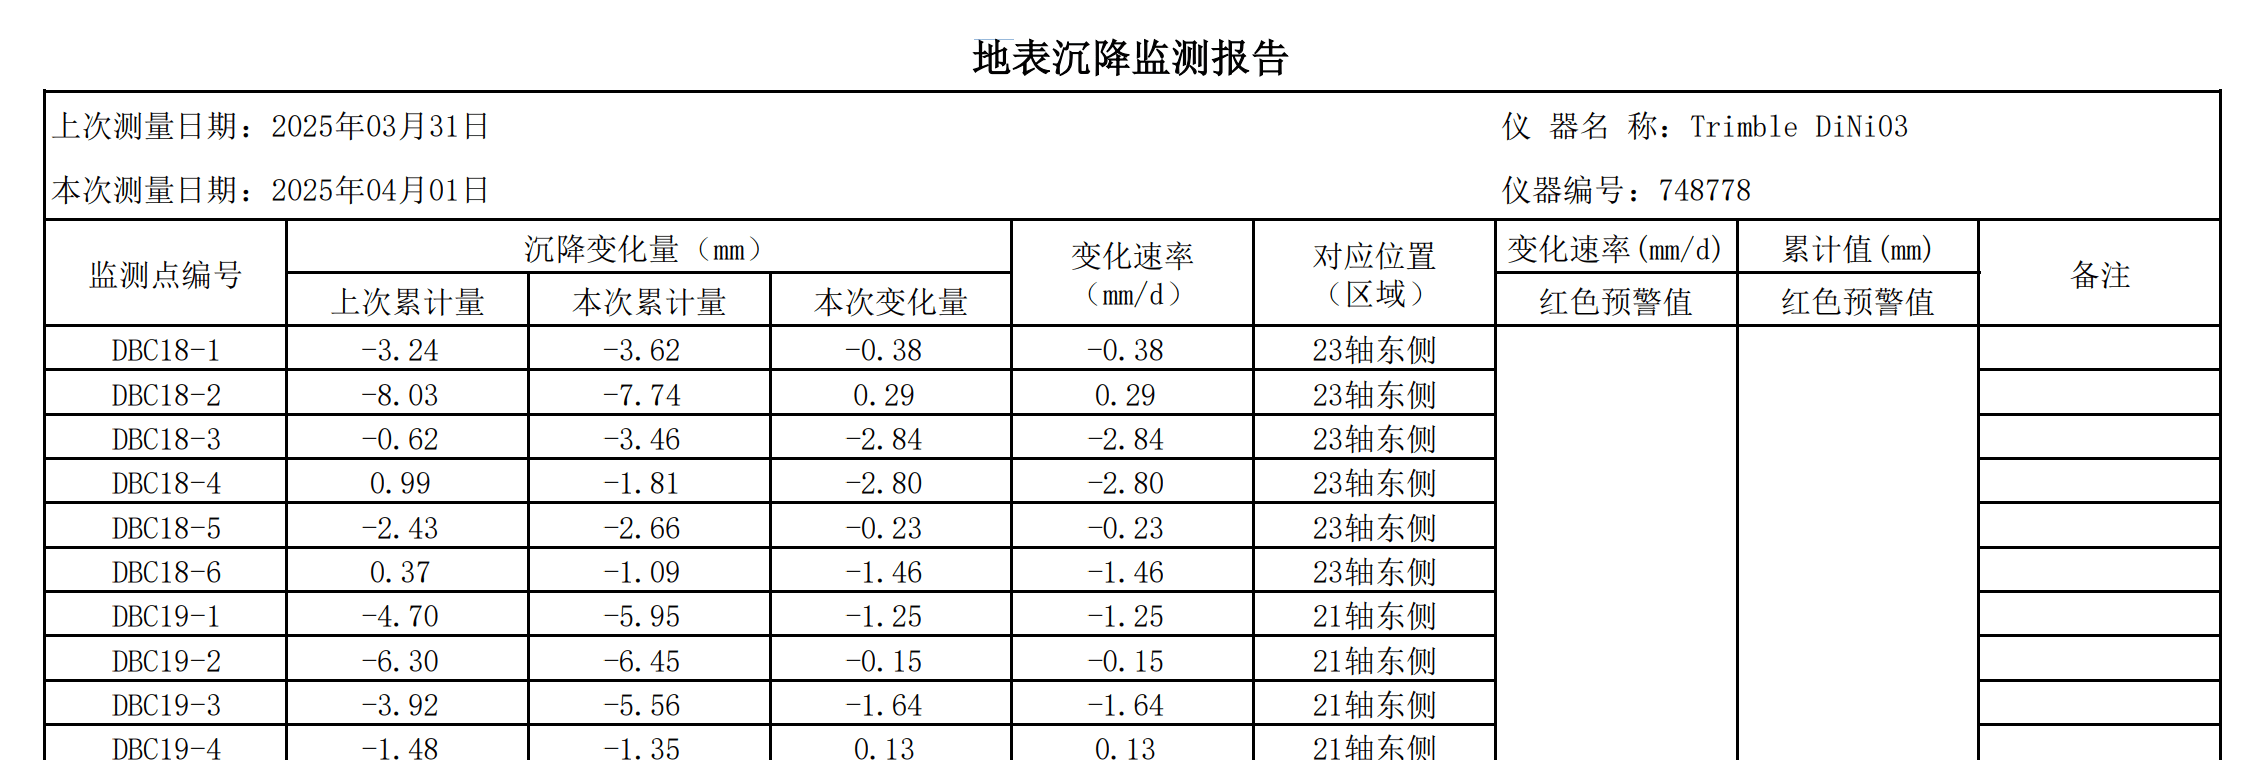
每个监测点的编号规则为英文字母-数字编号的形式,如DBC18-3、ZQC7、GXC-GS5等;
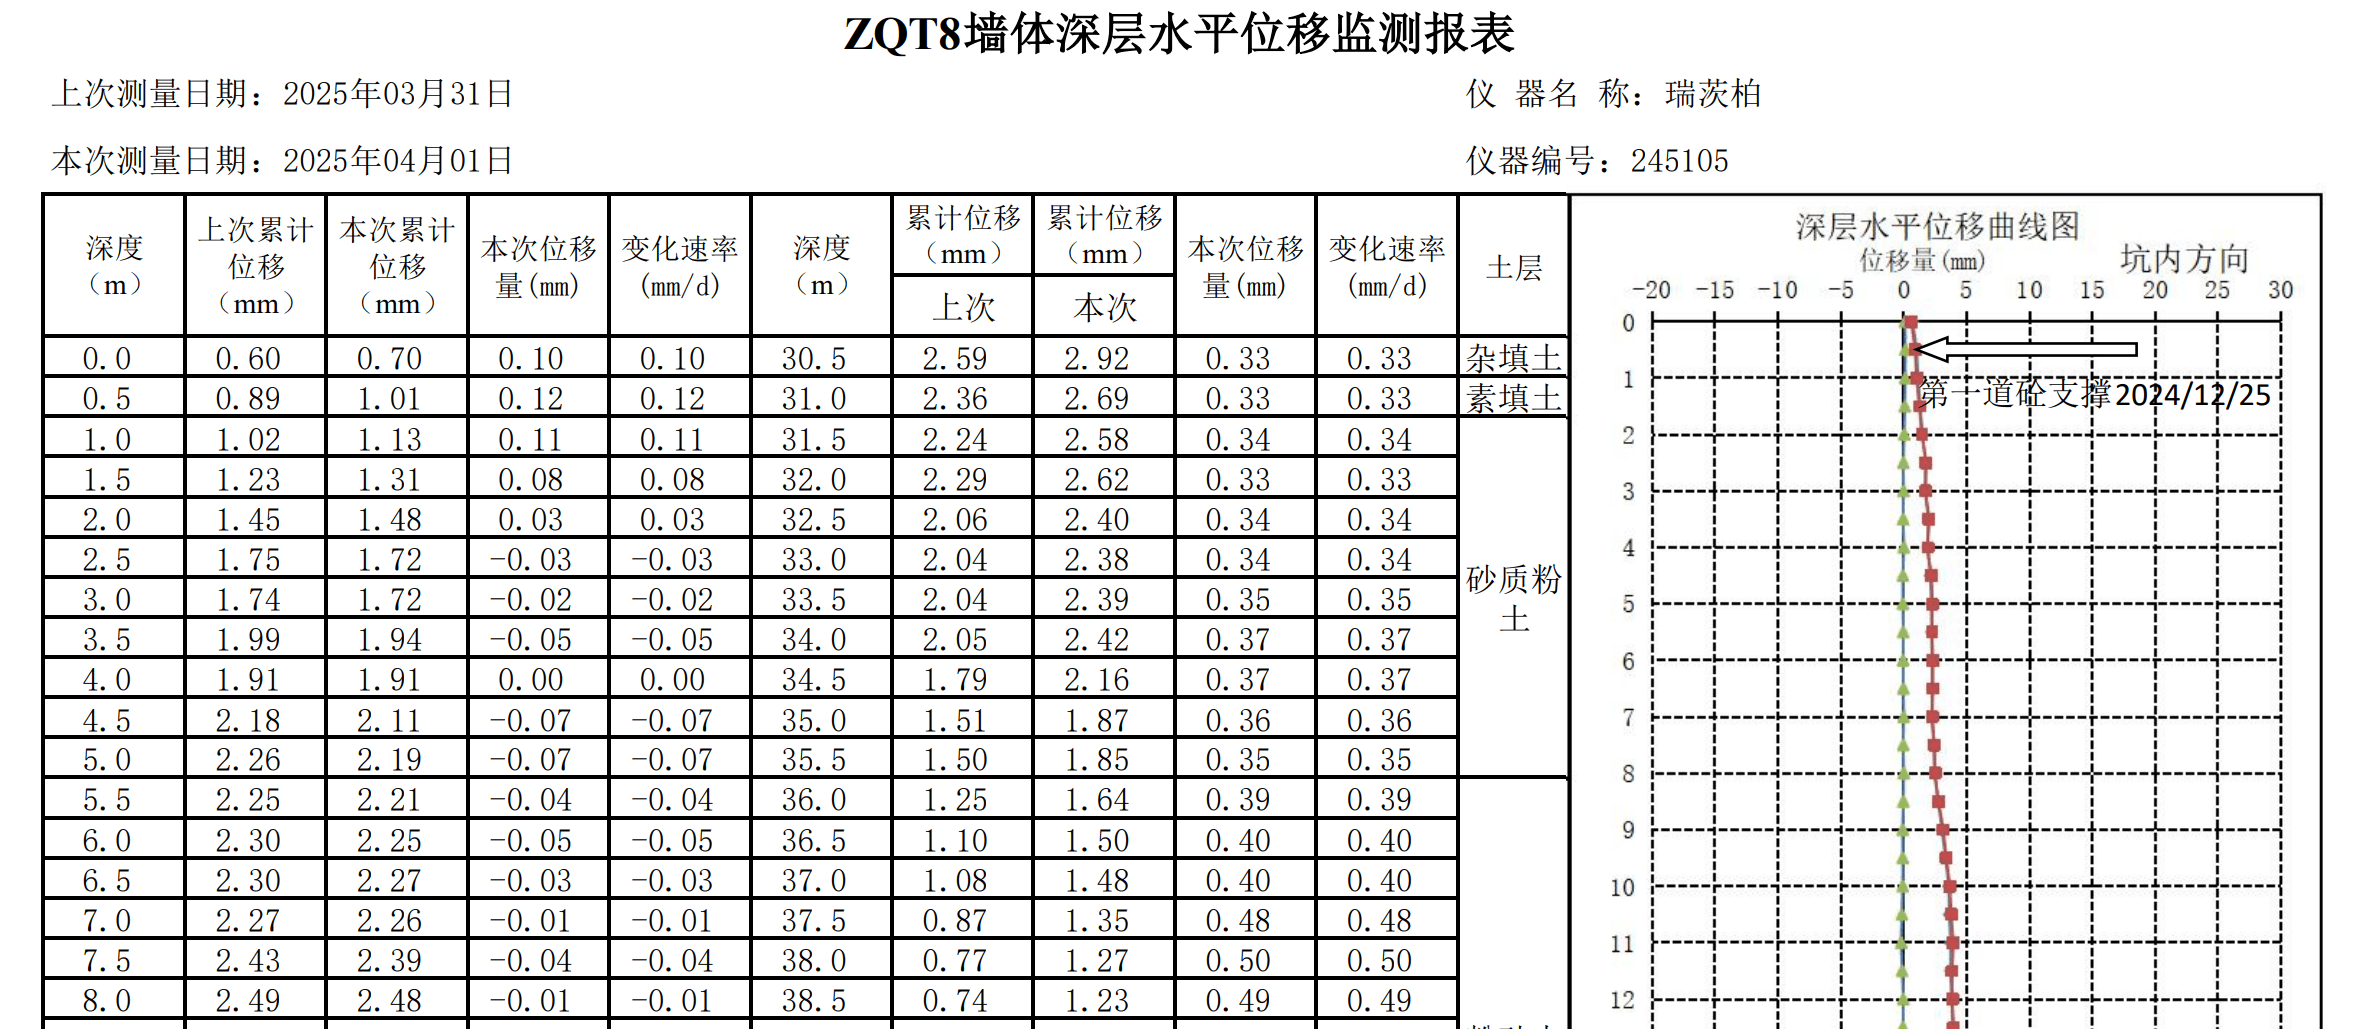
部分测点在指定的监测时刻上只有一个监测数据点,部分测点有多个监测数据点(如沿长度或深度分布),如地表沉降点DBC在一个时间只有一个数据;地连墙测斜ZQT在一个时间,有沿着深度分布的多个数据;
每一张报表包含一天的所有监测数据,如果要获取好些天的数据,则需要一大堆时间的监测报表;
监测数据在报表上呈现有固定的格式或规则,如下图所示:
啊哈,既然这些表格上的监测数据有相应的组织规律,那么就存在一些方法,能够把这些数据提取汇总成我们需要的样子。并且把整个流程自动化,让它看起来高效且优雅。
2. 我给数据提取任务设计了一个过程 在具体的数据分析中,笔者主要希望获得所有监测点编号,在给定的2025年03月28日-2025年06月16日的所有测点的名字、监测数据累积量及其对应的时间。结合笔者当前掌握的工具、方法和技术,创建了当前工作分解结构,以及单代号网络图(bushi)。整体流程如下:
使用PDF转Excel表格工具将监测报表转为Excel。很多工具能达到较好的效果,笔者这里测试了一些几个作为推荐:
WPS软件自带的PDF转换(有会员就相当好用,可以批量转换);
https://www.pdf2go.com/zh ,有免费额度;https://smallpdf.com/ ,有免费额度,效果很不错,但会把每页上的表切分成不同的Sheet,不方便读取;意表软件 ,应该能实现目标,但是要付费,没试。
分析转换之后的表格数据,分析所需要提取的监测数据呈现规则的一般规律,设计python程序的自动化提取规则;
检索所有转换好的Excel表格,遍历所有的Excel文件,逐个文件进行提取,将提取的数据保存至程序临时变量中;
优雅地自动化 :将提取工作改进为多线程程序,提高整体数据提取速度20倍以上;
将提取得到的监测数据,按照测点编号和监测时间进行透视,生成数据透视表储存为新的汇总好的Excel表,如下图所示。
下面将具体介绍第2、3、4、5步的关键过程、知识点和开放源代码。
3. 关键步骤 3.1 可能的知识点 后面的编程工作采用的是python编程语言,版本3.10.12,需要提前预装好几个关键模块,这里为了方便复现,给出了模块的版本:pandas=2.2.3、openpyxl=3.1.5、numpy=2.2.6。
Pandas 模块的数据检索与数据遍历;
Python正则表达式与字符串检索,系统性教程:菜鸟教程 ;
Pandas 模块生成一组或多组数据透视表,df.pivot或df.pivot_table;
3.2 分析表格中的数据类型 监测数据表格中主要存在两类数据类型,一类是在一个测点上有一组数据沿深度分布,主要为测斜数据;另一类是在一个测点上只有一个数据,除了测斜外几乎都是这种类型。因此,本文将数据提取的类型将其分为序列型数据和一般型数据。
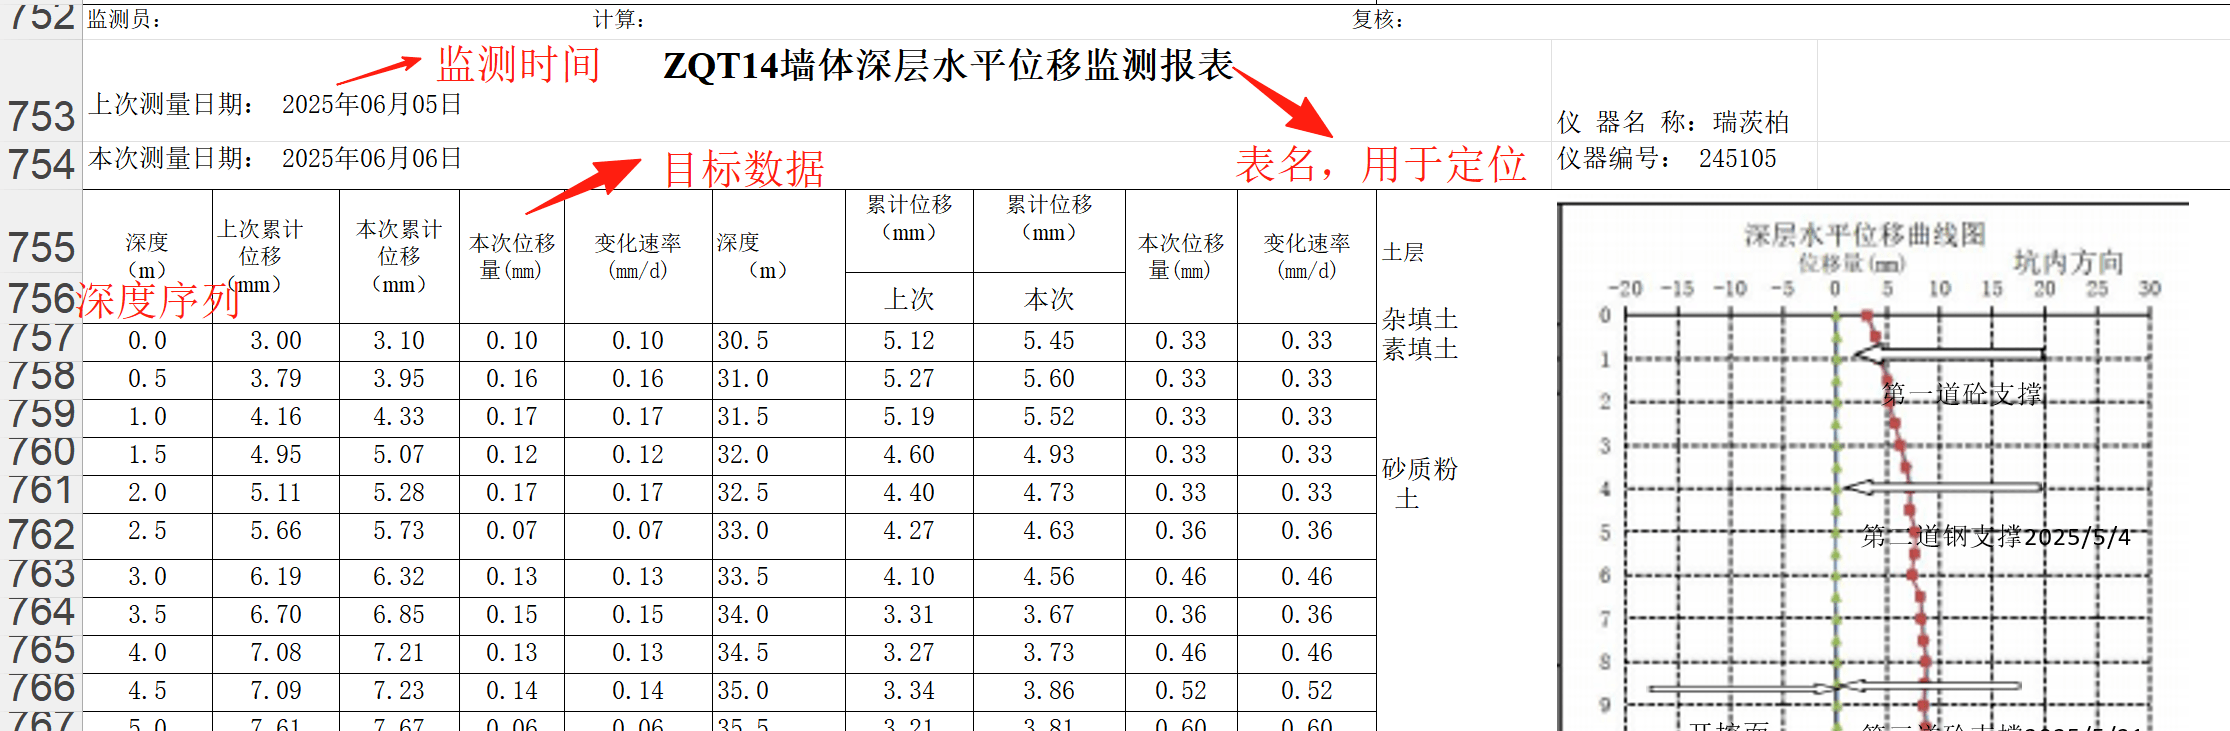
3.2.1 序列型数据 序列型数据形式如下图所示:
根据上图总结以下数据解析流程:
确定定位表头的位置
表头是一个合并单元格,合并单元格在程序中解析的位置是合并区域的左上角,意味着当前合并的单元格的的内容在第一列,列名为A;
表头的名字格式为ZQTXX墙体深层水平位移监测报表的形式,设计正则表达式^ZQT\d+匹配并提取以ZQT+数字为开头的字符串,获取测点名;
表头字符串中还应包含墙体深层水平位移监测报表,以确保提取出来的是正确的表头而不是测点名称介绍。
定位正确的数据类型列名行的位置,由于仅需要深度列和本次累计位移列,分别在第A列和第D列,因此对表头下遍历每一行,直至找到第A列和第D列是否同时包含深度和本次累计位移字符串串名即可,记录当前的行。
在找到数据类型列名后,直接向下遍历,记录深度列和本次累计位移列的数据,使用list.append储存在相应的数组中,直至发现读取的数据为空pd.isna()或数据为字符串而不是数字时停止。
根据以上数据读取逻辑,编写的程序如下:
1 2 3 4 5 6 7 8 9 10 11 12 13 14 15 16 17 18 19 20 21 22 23 24 25 26 27 28 29 30 31 32 33 34 35 36 37 38 39 40 41 42 43 44 45 46 47 48 49 50 51 52 53 54 55 56 57 58 59 60 61 62 63 64 65 66 67 68 69 70 71 72 73 for i, row in df.iterrows():'' .join(str (x) for x in row if isinstance (x, str ))r'(ZQT\d+)' , row_text)if not (m and '监测报表' in row_text):continue 1 )next (for j in range (i, min (i + 25 , len (df)))if isinstance (df.iat[j, 0 ], str ) and '深度' in df.iat[j, 0 ]),None if depth_head is None :continue next (for k, v in header_row.items()if isinstance (v, str ) and '本次累计' in v and '位移' in v),3 1 while k < len (df):0 ]if pd.isna(depth_cell):if k + 1 >= len (df) or pd.isna(df.iat[k + 1 , 0 ]):break 1 continue try :float (str (depth_cell).strip())except ValueError:break if pd.isna(disp_cell):break try :float (str (disp_cell).strip())except ValueError:break 1 'depth_m' : depth,'curr_cum_disp_mm' : disp
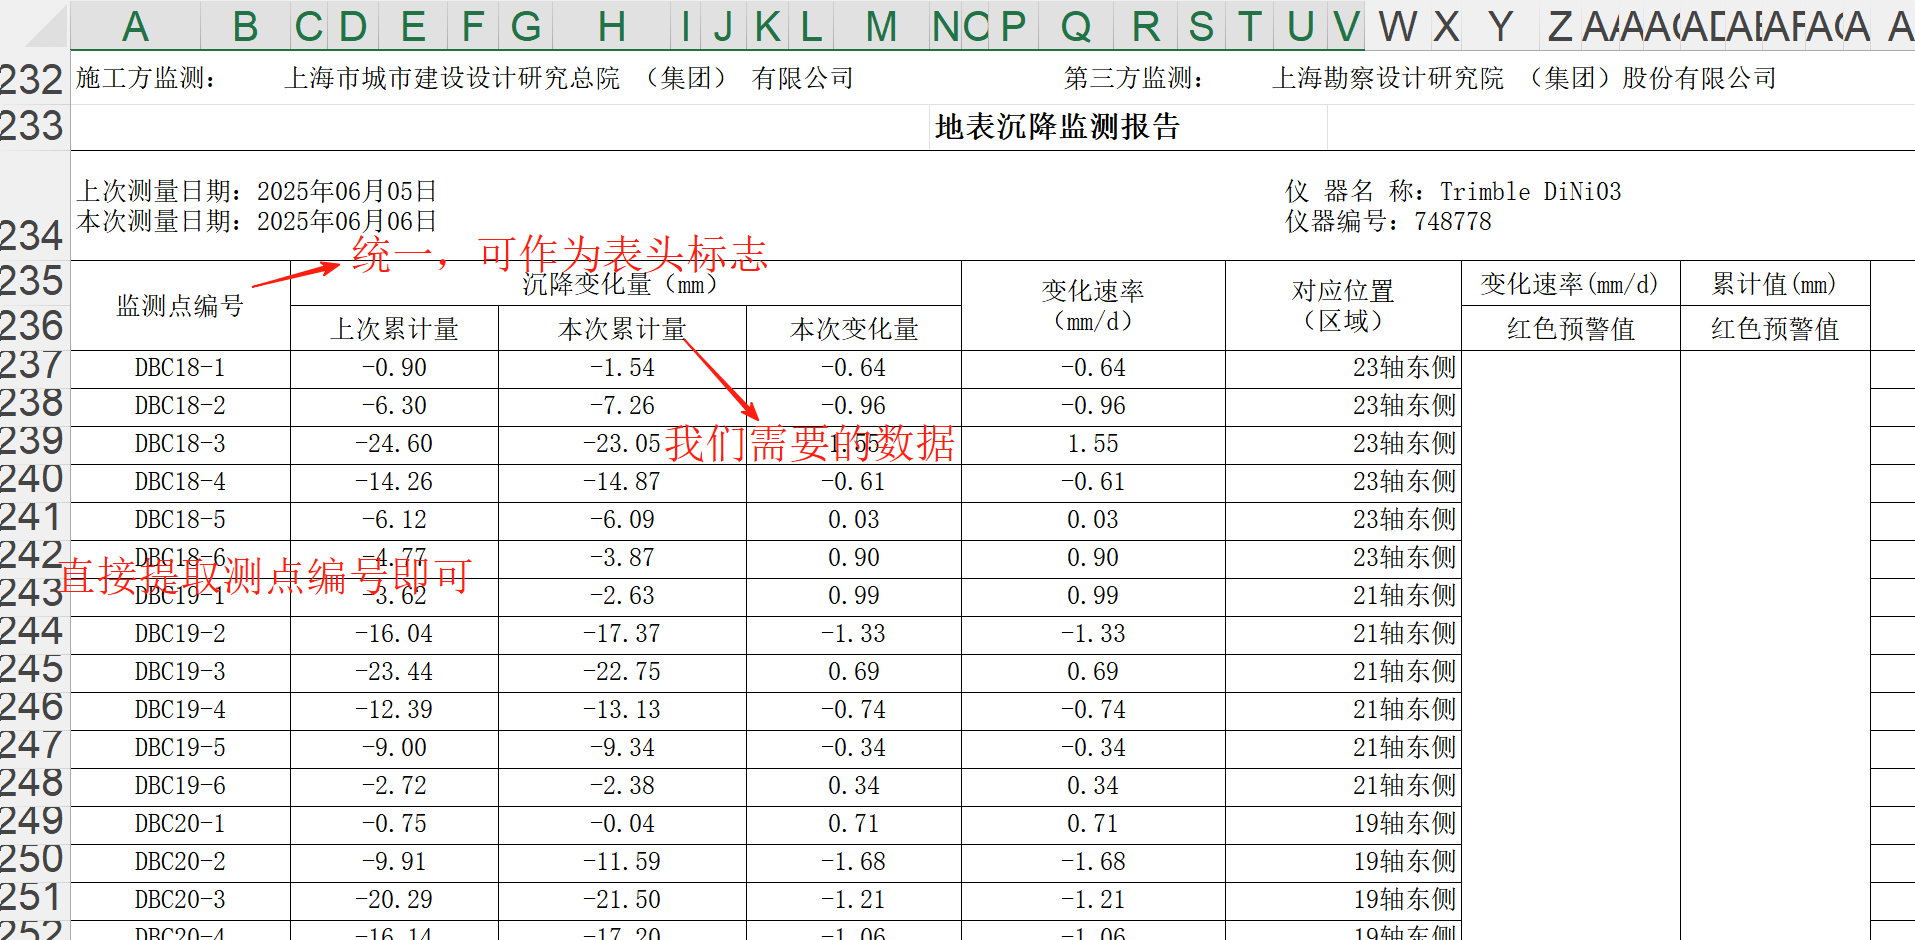
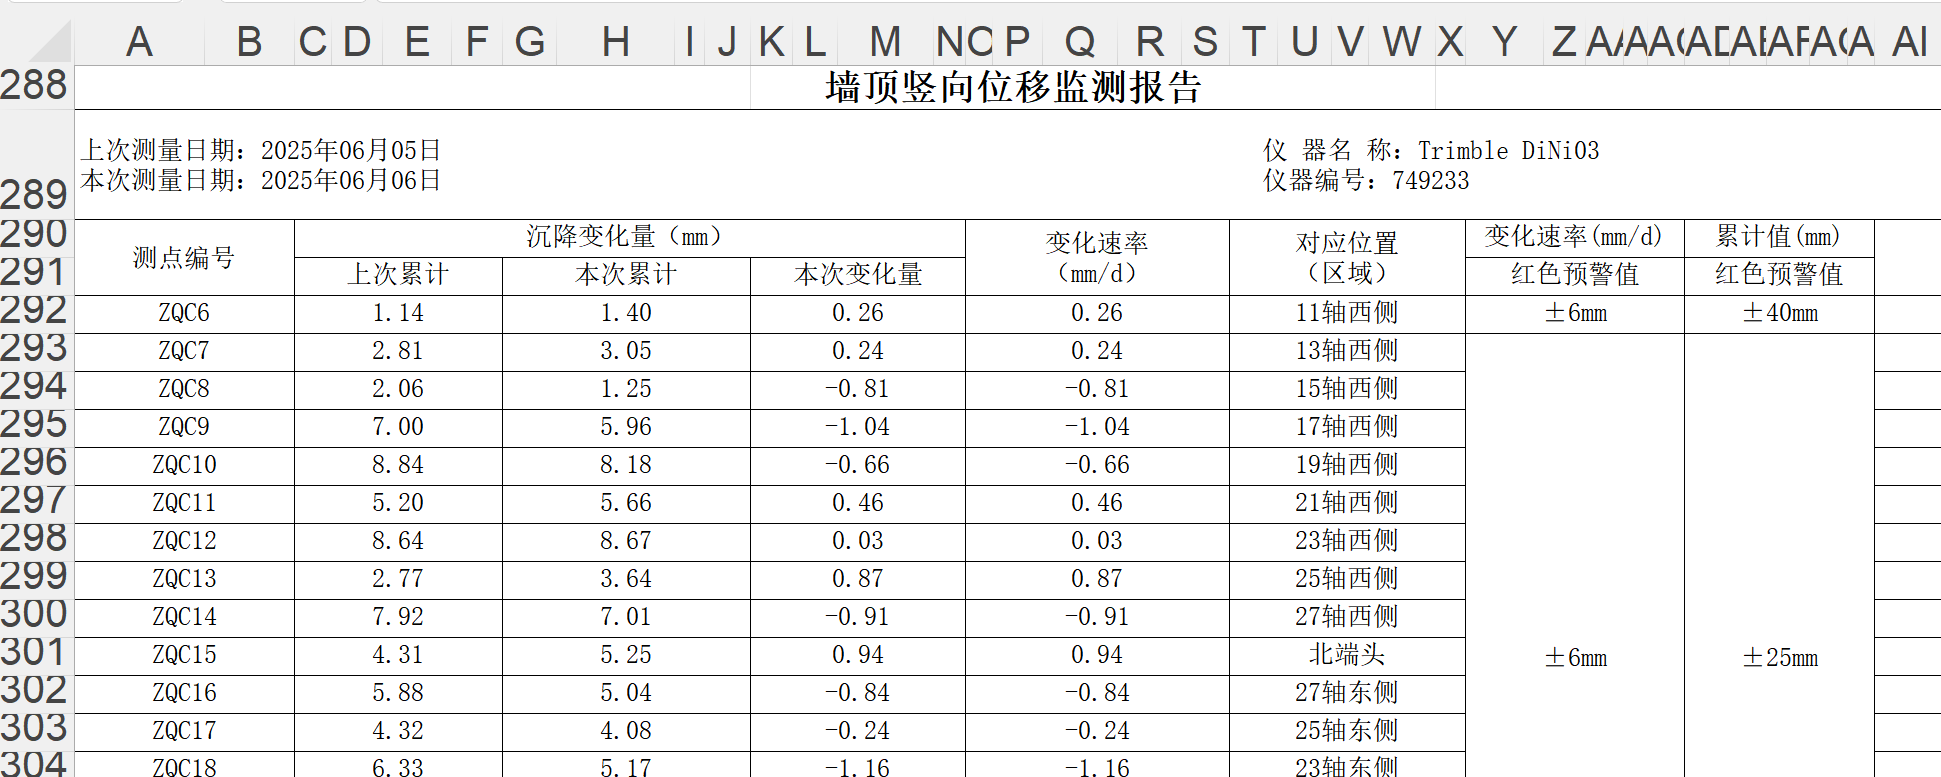
3.2.2 一般型数据 一般型数据的每个测点只对应一个数据,相比于测斜数据的行遍历,这类数据在遍历每一行时记录的每个数据都应对应一个新的测点进行储存。其在Excel表中的数据储存形式如下所示:
由图可得,不同类型的监测数据的储存格式是相同的,主要的区别在于测点编号的字母标识不同。因此他们可以共用一套数据检索方法,仅按照测点编号中前几位的字母进行区分数据类型。同测斜数据的检索,此类数据不需要再进一步检索表头,只需要定位第一列的测点编号列即可获得数据类型列名的位置,因此整个检索方法可以分解为如下步骤:
遍历表格中的所有行,找到包含测点编号和本次累计的行的位置;
从测点编号行往下遍历,找到每一个测点编号及其对应的本次累计的数值,直到遍历得到空行,或非数字;
编写正则表达式^[A-Z]+来提取测点类型,并分门别类进行储存。
具体实现代码如下:
1 2 3 4 5 6 7 8 9 10 11 12 13 14 15 16 17 18 19 20 21 22 23 24 25 26 27 28 29 30 31 32 33 34 35 36 37 38 39 40 41 42 43 44 45 46 47 48 49 50 None )for r in range (len (df))if str (df.iat[r, 0 ]).strip() == "监测点编号" or str (df.iat[r, 0 ]).strip() == "测点编号" ]for hdr_row in hdr_rows:if hdr_row is None or hdr_row + 1 >= len (df):continue 1 ]next ((c for c, v in enumerate (sec_hdr)if isinstance (v, str ) and ("本次累计" in v) or (v == "本次" )), None )if cum_col is None : continue 2 while row < len (df):0 ]if pd.isna(pid) or not str (pid).strip():break str (pid).strip()if not pid.upper().startswith(id_prefix.upper()):1 break try :float (str (val).replace("mm" , "" ).strip())except Exception:1 continue "point_id" : pid,"cum_settle_mm" : val1
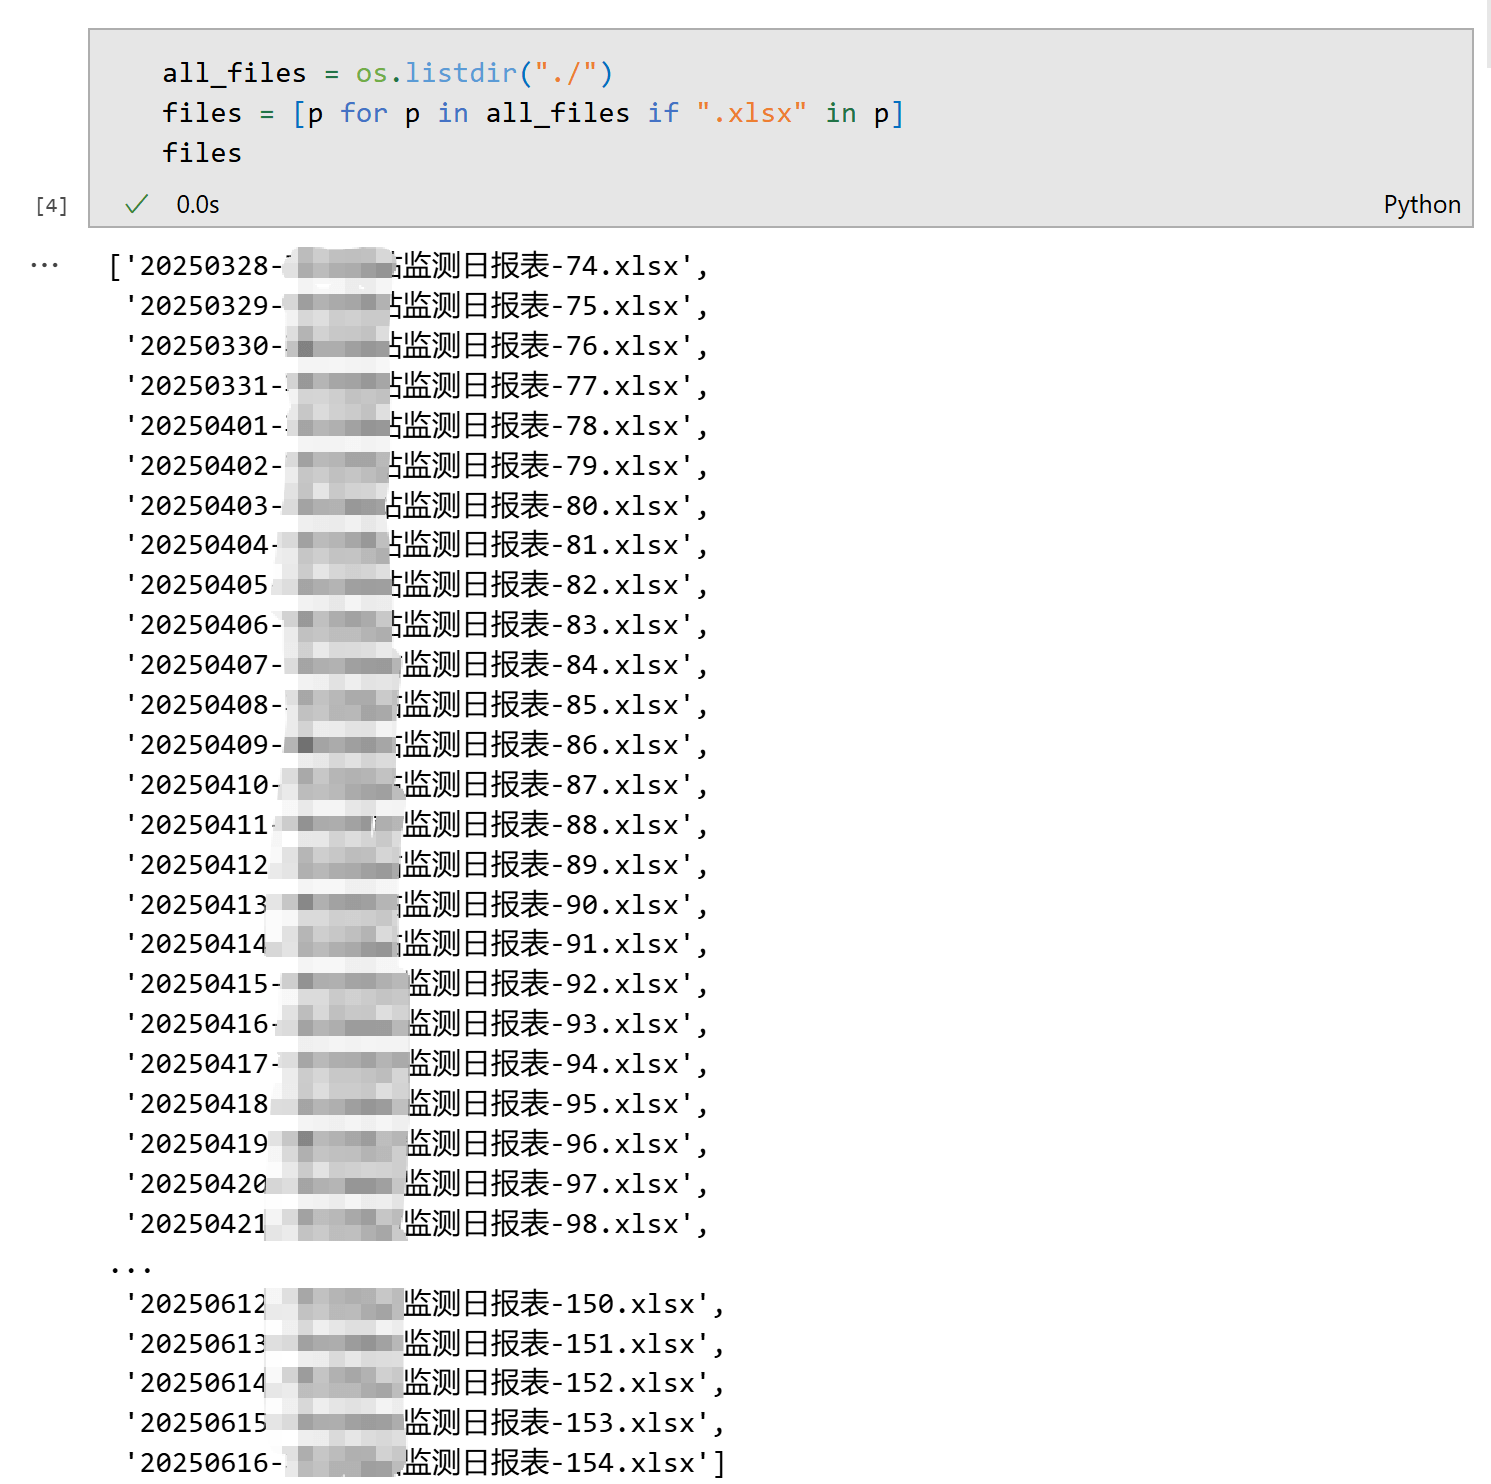
3.3自动遍历所有文件 使用os.listdir可以遍历当前文件夹下的所有文件,并进一步筛选以.xlsx结尾的文件的所有文件名。`
1
2
3
import os"./" )for p in all_files if ".xlsx" in p]
在获得了文件名后,通过循环,执行3.2.1和3.2.2小节中的数据提取代码即可完成监测报表的数据批量读取。
3.4 多线程——千线竞发,一意贯通 但是直接进行简单循环遍历,这里有八十多份文件,随着施工的推进,未来的监测数据还会更多,如何实现快速提取这些监测数据呢,可以采用python编程语言中的多线程,让多个数据提取的过程同时运行,以提高效率,能够减少20倍以上的数据提取时间。
在Python中除了线程还有进程的概念,这两者都可以让程序同时运行,但为什么用线程而不是进程?
读取 Excel 属于 I/O 密集,openpyxl 解压、XML 解析都在 C 扩展里释放 GIL,线程切换代价极低;而且 Windows 上 multiprocessing 还得鬼畜地 spawn 子进程,得不偿失。
多线程的主要实现过程有:
将需要并行执行的程序打包成功能函数;
调用Python的线程池管理模块,循环调用相关函数,并压入线程栈中;
等待各个线程执行完毕返回并记录结果。
代码如下:
1
2
3
4
5
6
7
8
9
10
11
12
13
14
15
16
17
18
19
20
21
22
23
24
25
26
27
28
29
30
31
32
33
34
35
36
37
38
39
40
41
42
43
44
45
46
47
48
49
50
51
52
53
54
55
56
57
58
59
60
61
62
from concurrent.futures import ThreadPoolExecutor, as_completeddef pick_date (path: str ) -> str :"""从文件名中抓取 8 位日期;若无日期则用文件名去后缀""" r'(\d{4}[01]\d[0-3]\d)' , os.path.basename(path))return m.group(1 ) if m else os.path.splitext(os.path.basename(path))[0 ]def extract_data_by_prefix (file_path: str , id_prefix="JGC" ):""" 解析单个 Excel,提取 point_id 以 id_prefix 开头的“本次累计量” 返回: (date, list[dict]) """ "openpyxl" )for sheet in xls.sheet_names:None )for r in range (len (df))if str (df.iat[r, 0 ]).strip() in ("监测点编号" , "测点编号" )]for hdr in hdr_rows:if hdr + 1 >= len (df): continue 1 ]next ((c for c, v in enumerate (sec_hdr)if isinstance (v, str ) and ("本次累计" in v or v == "本次" )), None )if cum_col is None :continue for r in range (hdr + 2 , len (df)):str (df.iat[r, 0 ]).strip()if not pid or not pid.upper().startswith(id_prefix.upper()):if not pid: break continue try :float (str (df.iat[r, cum_col]).replace("mm" , "" ).strip())except (ValueError, TypeError):continue "point_id" : pid, "cum_settle_mm" : val})return date, recordswith ThreadPoolExecutor(max_workers=16 ) as pool:"JGC" ): f for f in files}for fut in as_completed(fut_map):
3.5 将杂乱的数据提取记录变成科研友好的表格 前两节已经把 all_recs(JGC 单点) 和 total_ZQT(ZQT 多深度) 两个 “杂乱 list / dict” 储存在内存中。
现在就用两段代码把它们一键透视 + 按测点自动分 Sheet 输出成 Excel,后续绘图、统计都能直接调用。这里要用到Pandas模块中的一个核心函数:df.pivot_table。
3.5.1 pandas.DataFrame.pivot_table() 简介 DataFrame.pivot_table() 是 Pandas 中最常用的“数据透视”函数之一,可将一张“长表(long-format)”按照指定的行索引、列索引和聚合值重新排布成“宽表(wide-format)”。相比于简单的 df.pivot(),pivot_table() 允许对同一组合出现的多条记录进行聚合(默认使用 mean),并支持多重索引、缺失值填充、边际小计等高级特性。
核心参数
参数
作用
index作为行索引的列名或列表
columns作为列索引的列名或列表
values需要聚合到表格中的数值列
aggfunc聚合函数;可传字符串('mean', 'sum', 'max' 等)或自定义函数,默认为 'mean'
fill_value对生成的宽表中空单元格填充值
margins若设 True,计算行/列边际汇总(“Total” 行/列)
示例
1
2
3
4
5
6
7
8
9
10
11
12
df_long = pd.DataFrame({"date" : ["20250328" , "20250328" , "20250329" ],"point_id" : ["JGC1" , "JGC2" , "JGC1" ],"cum_settle_mm" : [1.2 , 0.9 , 1.8 ]"point_id" ,"date" ,"cum_settle_mm" ,"first" ,0 ))
结果:
point_id
20250328
20250329
JGC1 1.2
1.8
JGC2 0.9
0.0
官方文档地址(英文) https://pandas.pydata.org/pandas-docs/stable/reference/api/pandas.DataFrame.pivot_table.html
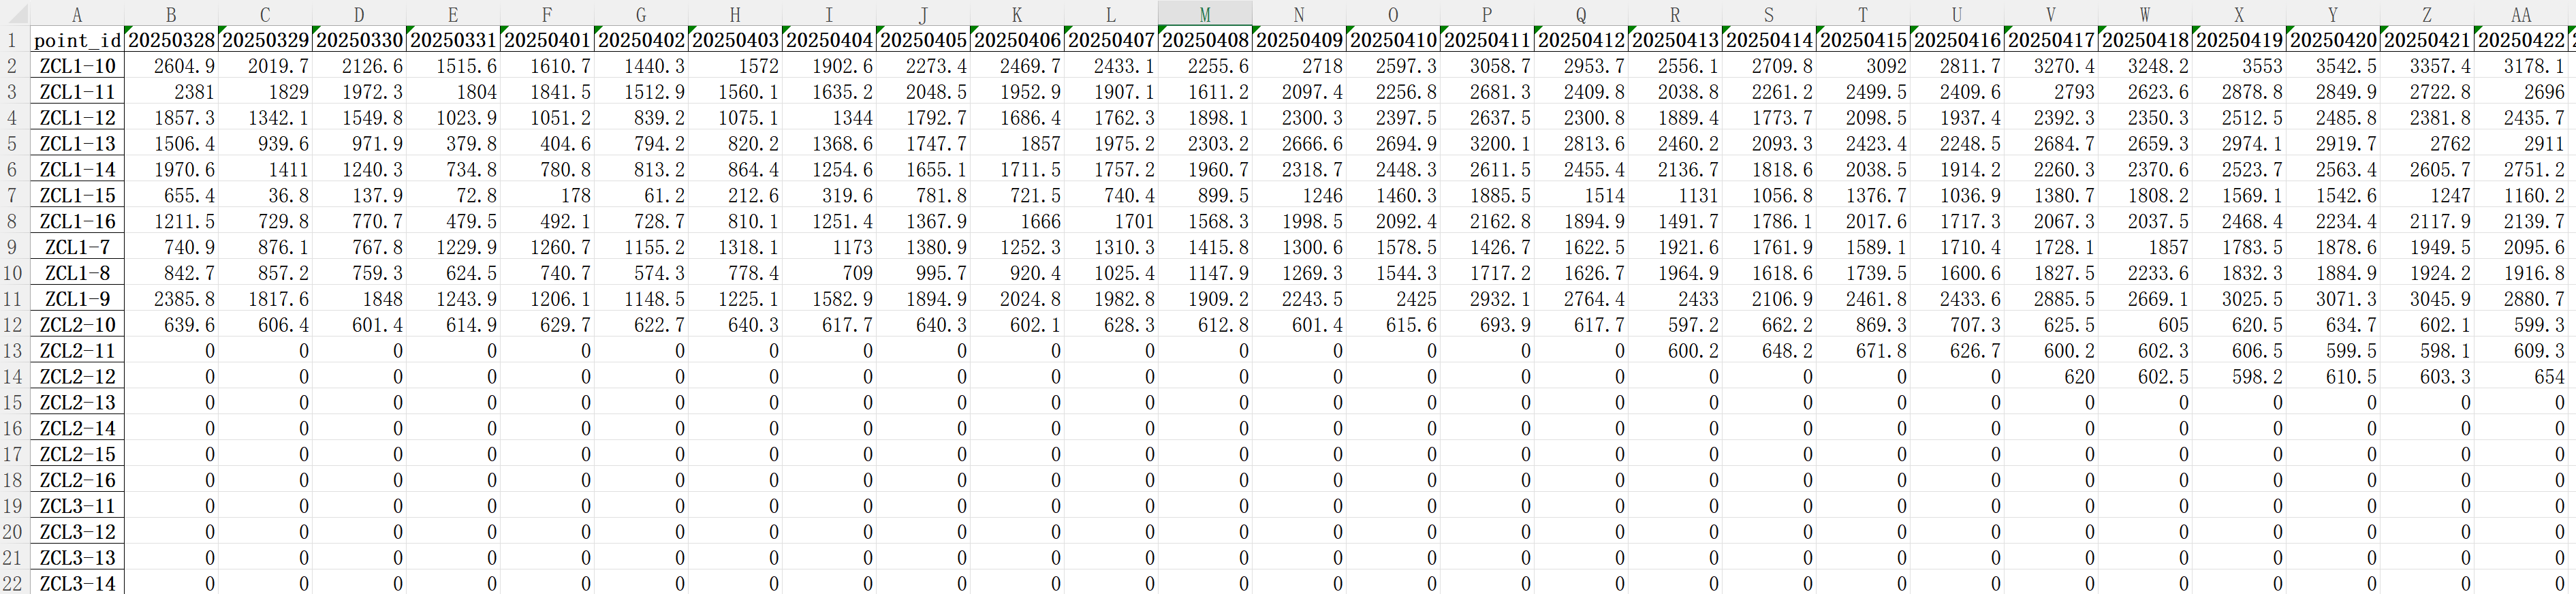
3.5.2 单数据点保存 基于pivot_table函数的介绍,这里逐行分析代码,以根据监测数据的特征生成透视表,并保存为Excel表格。
1 2 3 4 5 6 7 8 9 10 11 12 13 14 15 16 17 18 19 20 21 22 23 24 25 26 27 28 29 30 31 32 33 34 35 36 37 38 39 "out_put/" def save_single_point_data (out_dir: str , file_name: str , data: dict ):compile ("^\\D+" )"" for date, lst in data.items():for d in lst:"point_id" ]"point_id" : d["point_id" ],"date" : date,"cum_settle_mm" : d["cum_settle_mm" ]"point_id" , columns="date" , values="cum_settle_mm" , aggfunc="first" )sorted (df_wide.columns), axis=1 )0 )"_" + file_nameif not os.path.exists(out_dir):".xlsx" , all_recs)
最终输出的监测数据文件如下图所示:
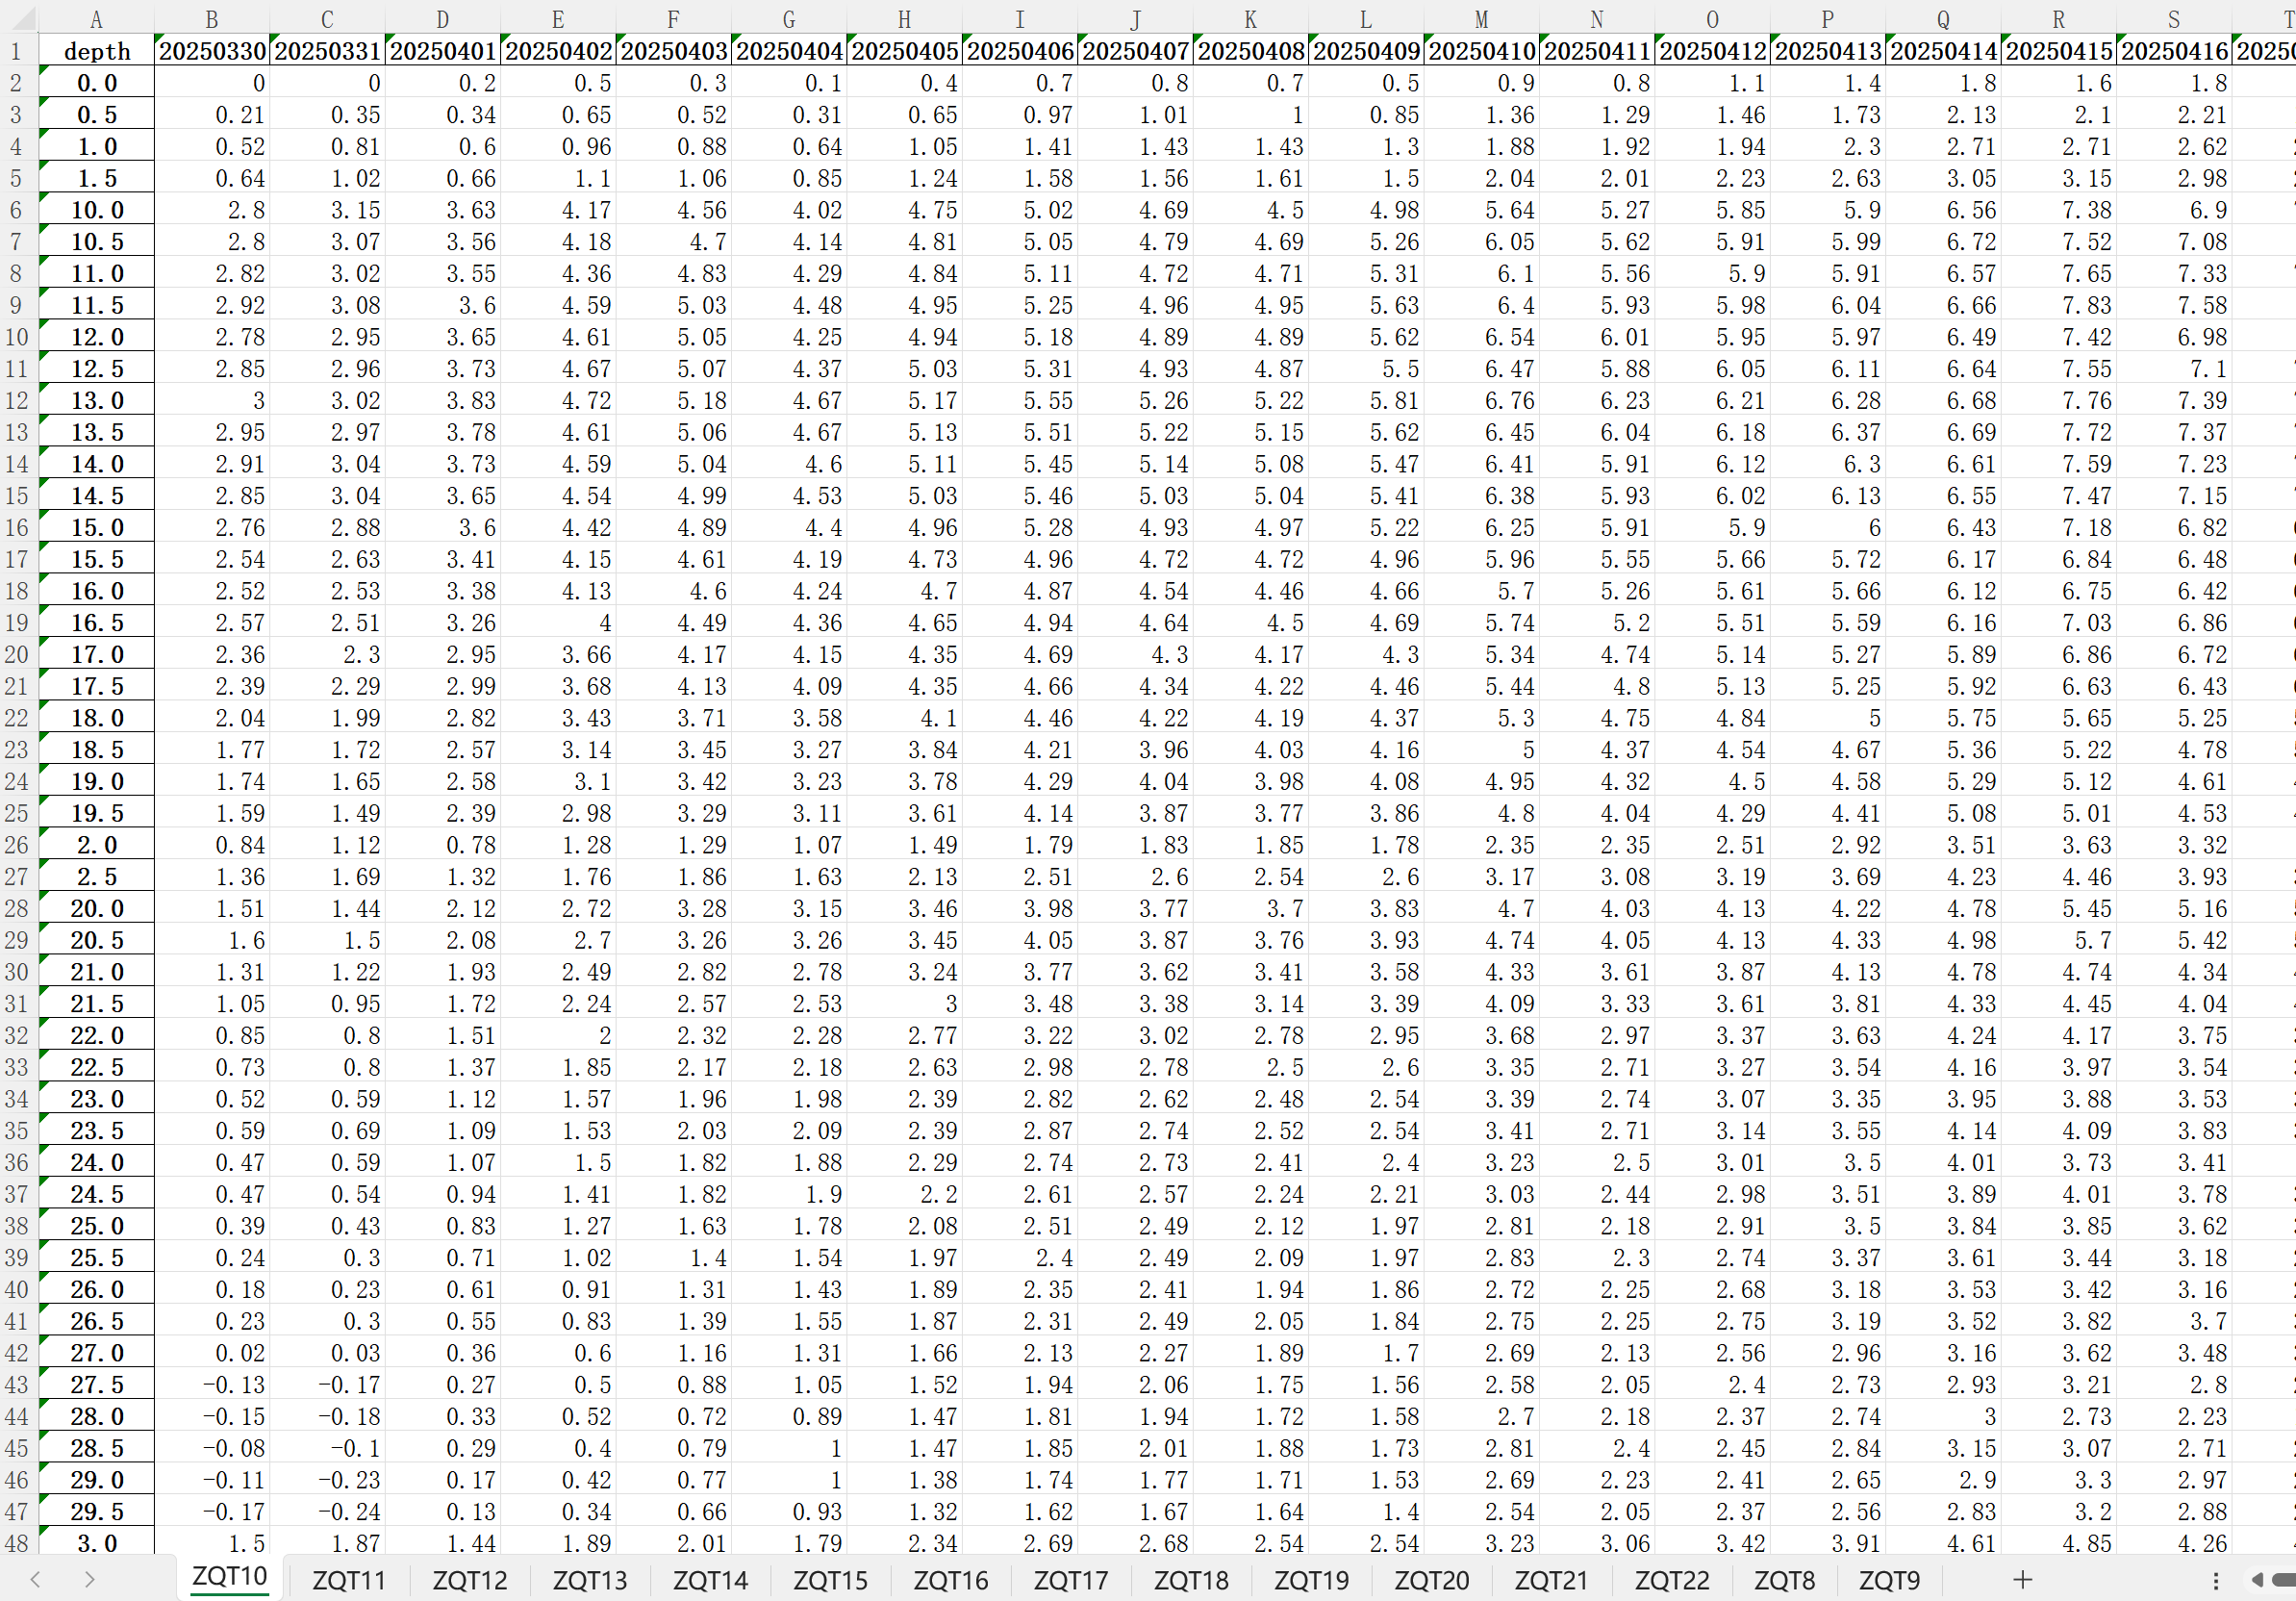
3.5.3 测斜数据保存 测斜数据与单测点数据保存的主要区别在于,每个监测点位都单独成一张表,且表的纵向索引为深度,水平列名为时间。将所有的监测点汇总到一个Excel文件中,每个测点作为一个Sheet存在,代码如下:
1
2
3
4
5
6
7
8
9
10
11
12
13
14
15
16
17
18
19
20
21
22
23
24
25
26
27
28
29
30
31
32
33
34
35
36
37
38
39
40
41
42
43
44
def save_multi_point_data (out_dir: str , file_name: str , data: dict ):compile ("^\\D+" )"" for date, data_dict in data.items():for key in data_keys:"depth_m" ]"curr_cum_disp_mm" ]for i in range (len (depth_keys)):"point_id" : key,"date" : date,"depth" : str (depth_keys[i]),"displacement" : disps[i]"_" + file_namewith pd.ExcelWriter(out_file, engine="xlsxwriter" ) as writer:for pid, sub in df_long.groupby("point_id" ):"depth" ,"date" ,"displacement" )True ) ".xlsx" , total_ZQT)
最终输出的监测数据文件如下图所示:
小结 至此,一个优雅地从PDF报表中提取监测数据的流程已经完结,下面是在撰写这篇教程的一些复盘小结:
模块版本踩坑 —— 建议在虚拟环境里锁定 pandas==2.2.3、openpyxl==3.1.5、numpy==2.2.6,不然 read_excel 的参数有时候会小改动。
线程池 vs. 进程池 —— 解析 Excel 大多 I/O bound,ThreadPoolExecutor 足够;如果后期要做 CPU 密集型曲线拟合,可换 ProcessPoolExecutor。
正则表达式防御 —— 现场报表五花八门,pid.upper().startswith(id_prefix) 足够灵活;若遇到 JGC-GS5-1 之类加尾巴的编号,也能被捕获。
批量日期识别 —— 文件名最好统一 YYYYMMDD_XXXX.xlsx ;若实在参差,pick_date() 里的正则再加一条备用格式即可。
微信公众号